Creating an Animated Bar Graph
The true value of software lies in the ability of end users to input and extract data. Data input is commonly handled by forms and to a degree creative freedom is often limited to simply keeping the interface out of the way of the user; for me the really fun part is in the output of the data, where far greater creative freedom exists.
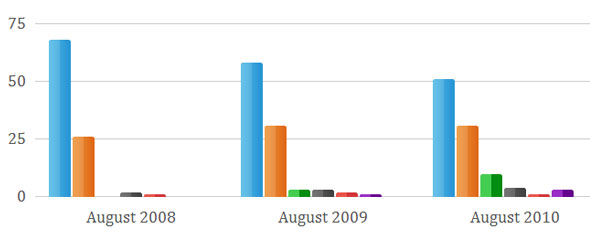
I am always looking for ways to increase the value of the software I produce and was excited to discover an article on creating an animated bar graph with HTML, CSS And jQuery from Smashing Magazine. Following this tutorial I was able to produce an exciting animated jQuery graph which falls back to a very accessible and good looking data table when JavaScript is disabled.
Expanding upon the tutorial I converted it to use a HTML5 structure and adapted the scale and animation behaviour to better fit the data I was attempting to visualise.